Exploring Linearity with Graphs
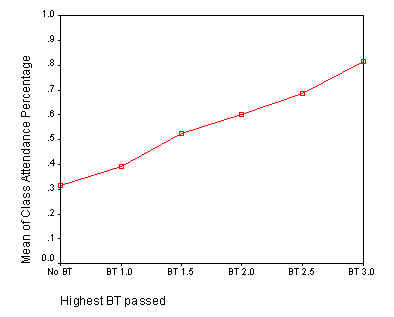
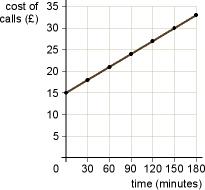
The two graphs below allow us to see real world examples of a linear relationship. After discussing the information involved in these graphs individually and with a partner we will share our findings with the class. After looking at these real world examples of linear relationships we will work to create a graph of our walking rates that we collected in the introduction. We will use this graph to construct tables and see if our walking rate data is a linear relationship in the sense of time v. distance.
Main Learning Target: Describe the patterns of change for variables in linear relationships from graphs and tables. Also be able to Construct tables and graphs to represent linear patterns of change.
Main Learning Target: Describe the patterns of change for variables in linear relationships from graphs and tables. Also be able to Construct tables and graphs to represent linear patterns of change.
| attendance_v._bridge_test_scores.jpg |
| time_v._cost_of_a_phone_call.jpg |
